I chose the declining bat population in Wisconsin as my project. I wanted to research why this is happening and if there are any factors contributing to this. I chose to see if this decline was based on certain criteria. The study question is, is the bat population declining in Wisconsin, and if so where and is there something responsible for it. My hypothesis is that the decline is due to many factors but the most important one is that the increased amount of pesticides are part of the problem and maybe the biggest part. In my results section I included maps that show that the more pesticides in an area that is where the decline is the greatest. Instead of finding the most suitable areas for bats, I chose to research the areas where there was a decline.
Methods:
I used a series of analysis done by the Wisconsin Department of Natural Resources to show the amount of bats in each of the counties that had enough data to go on. In the information I received from the DNR, there were many counties that did not have enough data to use in my analysis, namely Stonefield, Dodge, and Yellow Lake. These counties only had data for one year or for only a few detection sites and not significant enough to map or analyze. The counties chosen to analyze to see if there has been a decline in the population of bats are as follows, Grant, Iowa, Lafayette, Trempealeau and Door Counties.
First I analyzed he data from the DNR, then I decided to see if my hypothesis was right that the bat population in Wisconsin is declining. I did this by adding all the bat radar analysis. On the nights the researchers went out, they used the counts of bats to see where the bats were and how many. The researchers went out at least 10 times per site and some other sites they had more visits. Because of this I normalized the data. I chose the most recent data provided and did an analysis of 2014 and 2015 to see if there was a difference. I also used a buffer of 500 feet away from a major road or interstate to see if the bats are staying closer to roads that have trees or it they are staying near trees in the wooded areas. I then used the Euclidean distance to see if the distance between two points and counted in metric space, I selected the distance from the center of the cities of Wisconsin. The next tool I used was intersect, I intersected all the buffer zones.
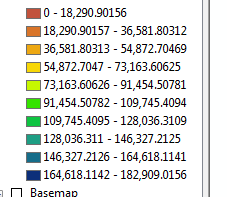
First is the map I created in ArcGIS with the above counties and the counts of the bats for 2014 and 2015, it shows that the population did in fact decrease. The map also shows that there are not many bats near larger cities and where many major interstates are present. If you notice in maps 1 and 2, of Wisconsin Bat Population of 2014 and 2015, the area on the south eastern part of the state has very large populations and there are not bat hibernation cites in this area. This is also true for the other counties that bat population has been counted in. Bats tend to be in areas of less human traffic. The below map shows that the population of bats decrease in Lafayette and Door Counties, there was a small decrease in Iowa county and Grant increased. This increase in Grant County could be due to the amount of increase traffic in Lafayette county or it could be the pesticide use, or many other factors. The map clearly shows that there is a decrease of over 1,000 bats in Lafayette County.
 |
| Maps 1 and 2: Shows increase of bat population. 2015 map includes cities of Wisconsin for emphasis. |
Next, I created a buffer of 500 feet from roads so we could see the if this played a role in the amount of bats in an area.
 |
| Map 3: Buffer zones of 500 feet from major roads. |
The next tool used was the Euclidean Distance and I chose to use it from the center of a city in Wisconsin. Below is a map of the areas and how far from the city most of the bats are, if you notice at the bottom left or southwestern part of the image, it shows the distance from the center on Grant, Iowa and Lafayette Counties are not near the center of bigger cities. Bats need trees or caved areas to live in which are not usually located near large cities.


No comments:
Post a Comment